Problem
This independent portfolio exercise demonstrates how a retail transaction model can support a clear sales and profit report. It was not commissioned by or performed for an actual retailer.
Data
The repository identifies the 2024–2025 retail dataset as synthetic, generated with AI assistance and randomized using Excel. It does not represent real customers, stores, or company performance.
Approach
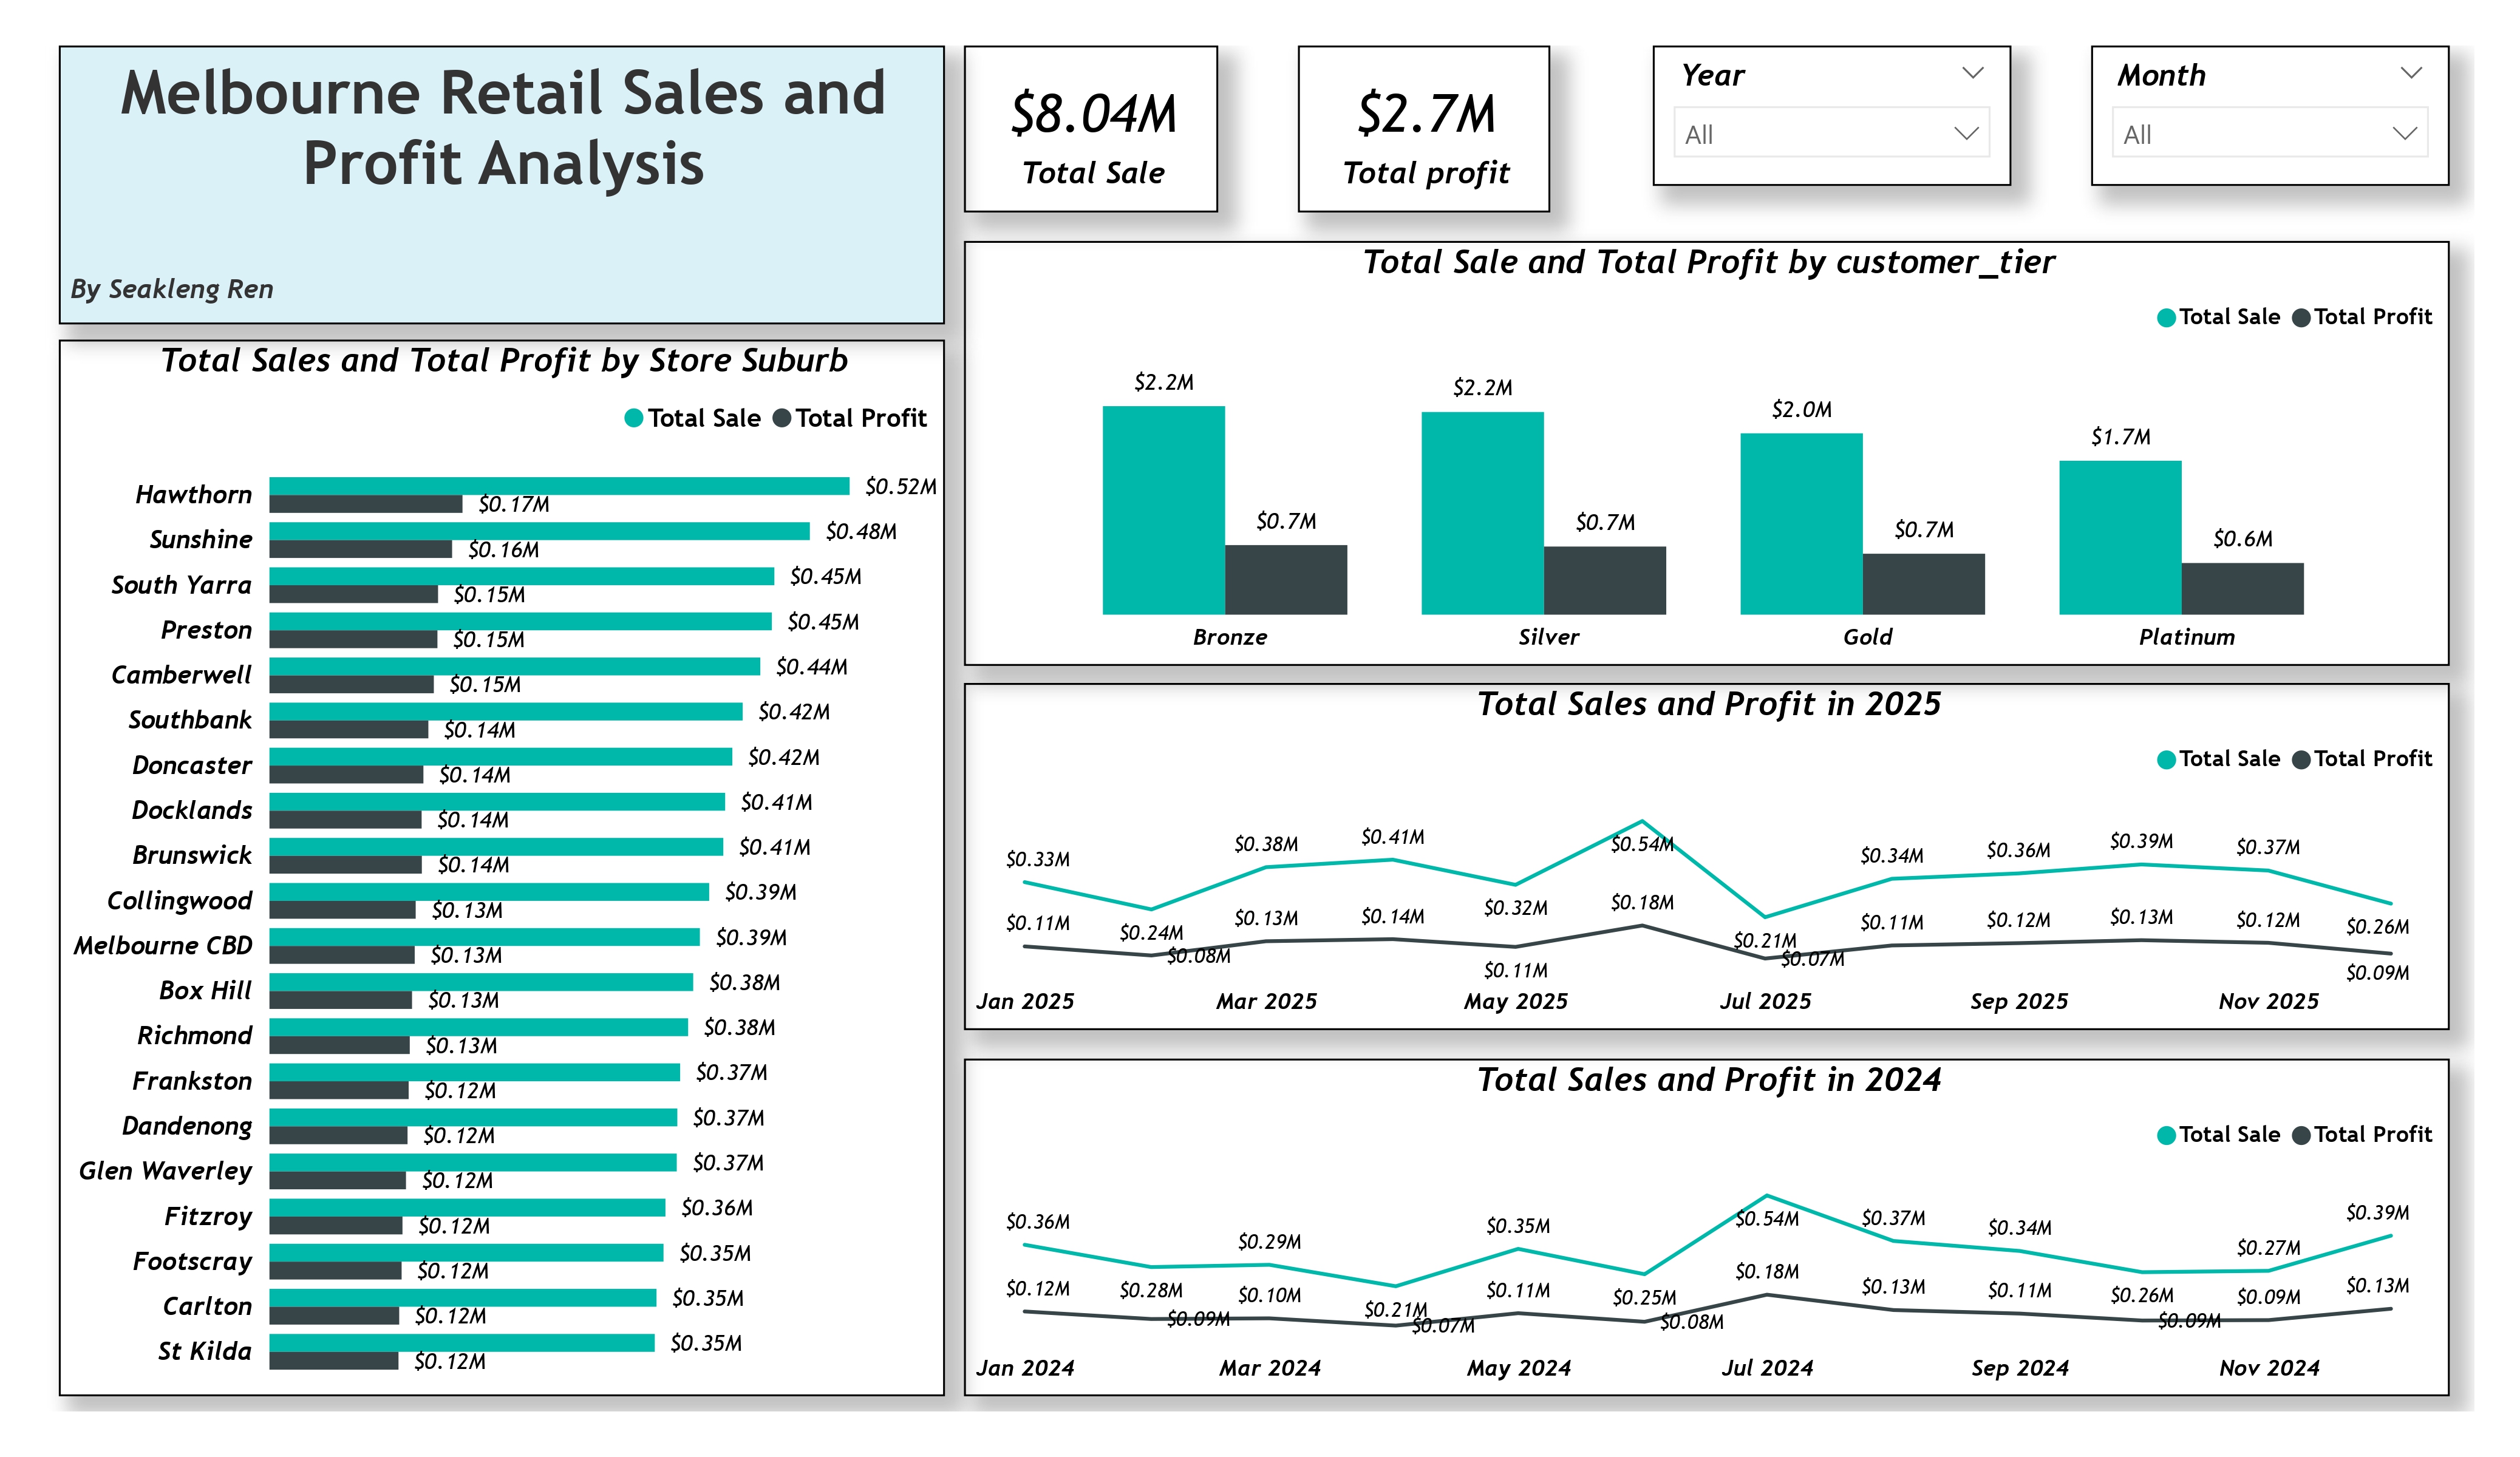
The model diagram shows a transaction fact table connected to customer, product, order, and store dimensions. The report presents sales and profit by suburb and customer tier, with month and year comparisons and filters.
Technology
Power BI and a synthetic retail CSV dataset.
Solution
The deliverable is a Power BI report with summary cards and interactive views for exploring the sample across locations, customer tiers, and time.
Results and limitations
The report and model are the project deliverables. The displayed totals, store rankings, customer-tier comparisons, and monthly patterns describe only the synthetic sample; they are not evidence of actual performance, forecasts, or business impact.
Methodological learning
The exercise demonstrates how related transaction and dimension tables can organize a report for comparison across several business views. Because the data is synthetic, the analysis is useful for demonstrating the workflow, not validating a real business decision.